Open it
On the Mac
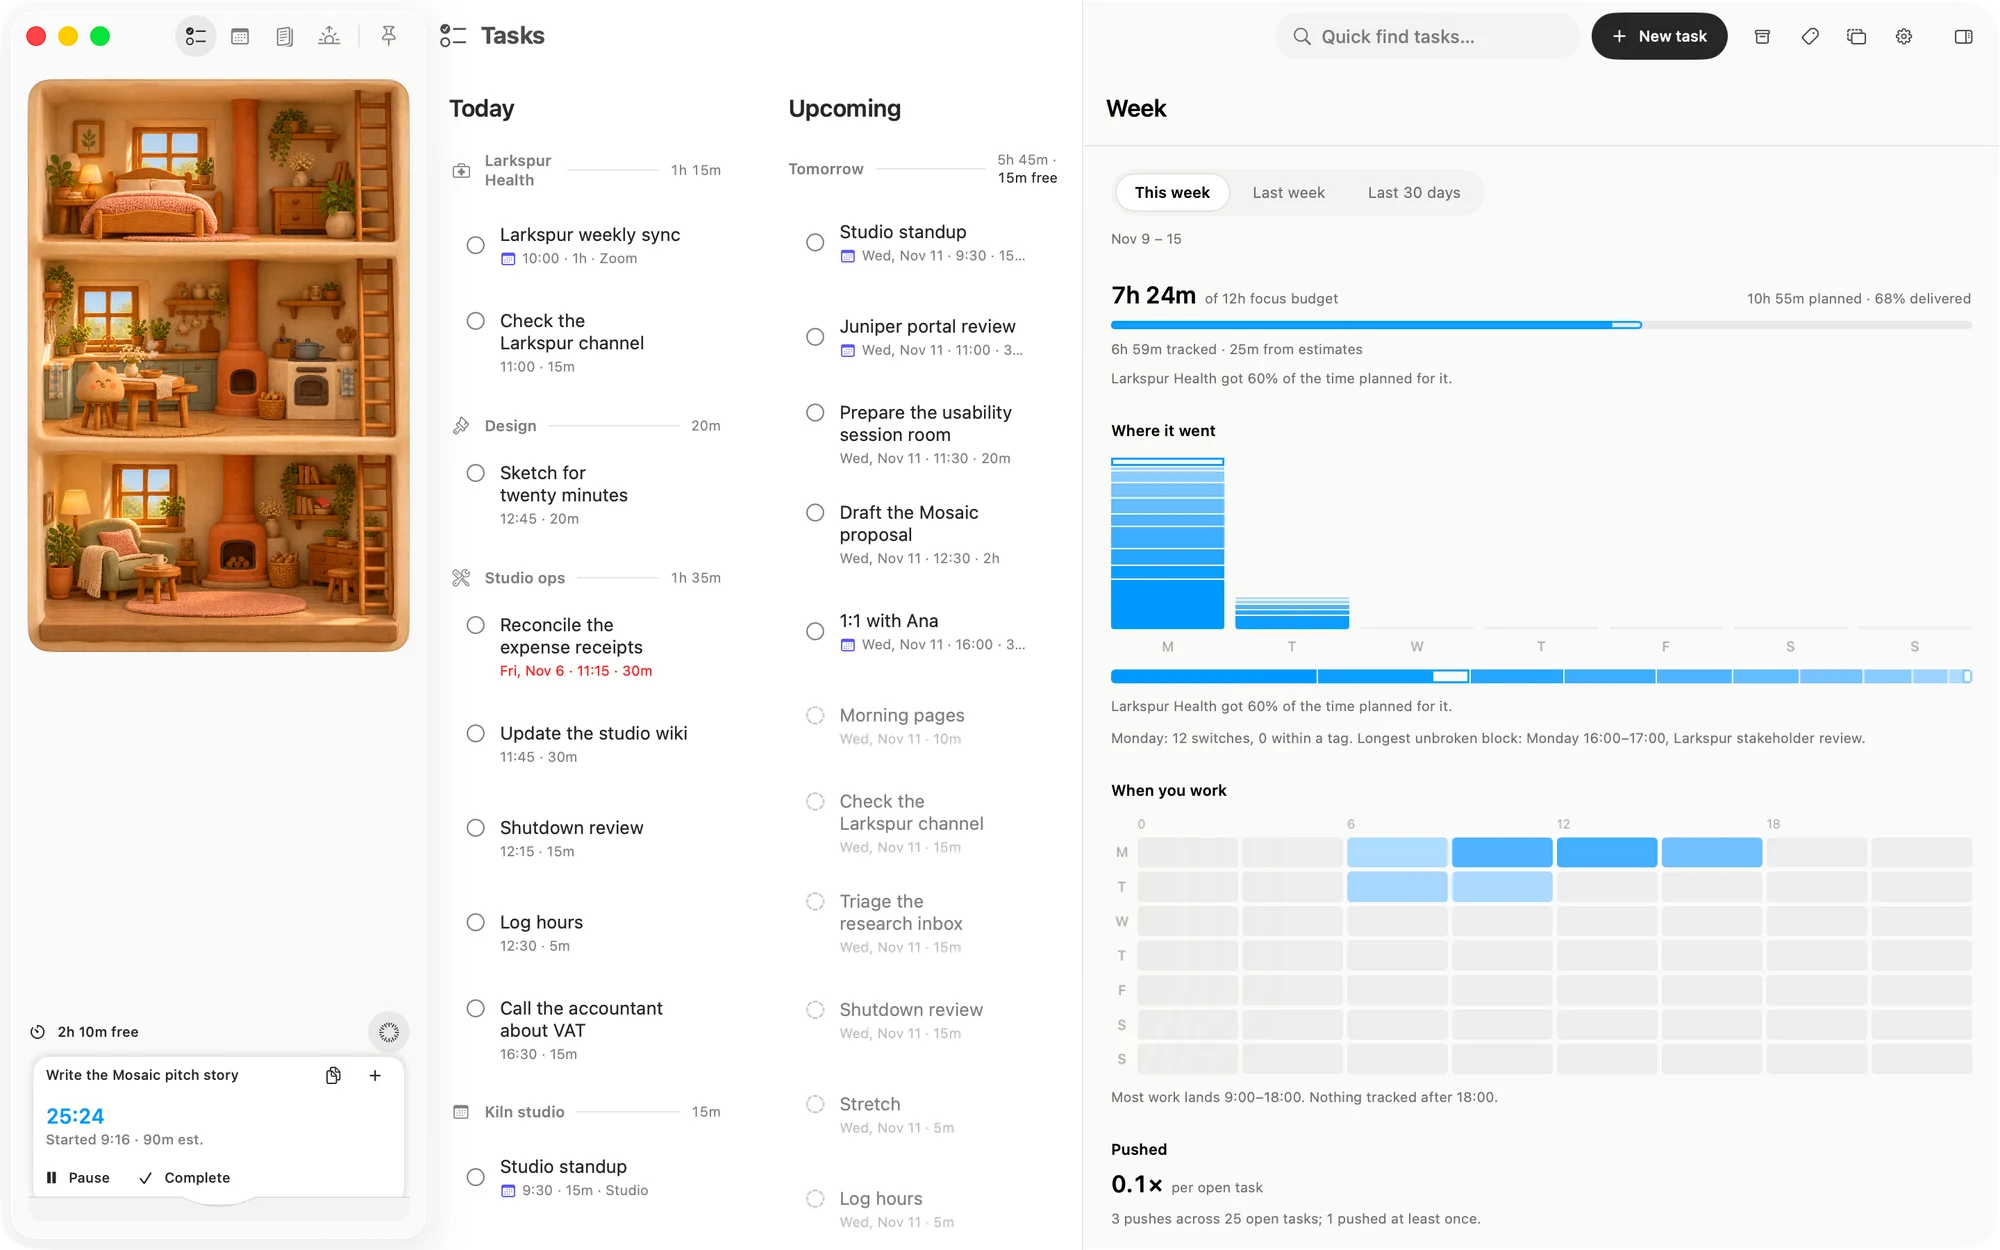
It opens in the side panel, from any page.
- Click the round Analysis button in the work bucket's header, at the foot of the sidebar.
- Or click the capacity reading beside it, then Analysis in what opens.
Click the button again to close it. ⌃⌘I closes the side panel too, and brings back whatever it last held.
On the iPhone
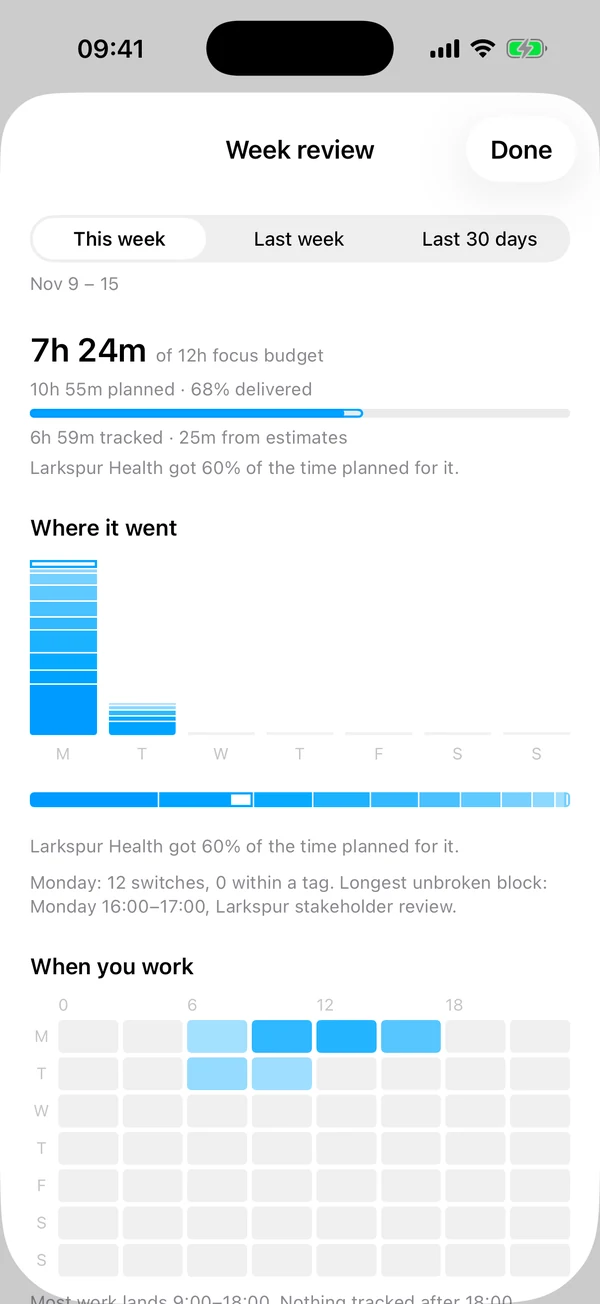
- On Tasks, tap the circle beside the tab bar, then More, then Analysis.
- Or, with nothing running, tap the day at the top of Tasks.
Done closes it.
Pick a window
Choose This week, Last week or Last 30 days. The dates it covers are under the choice.
A week starts on the day your device's calendar says it does. In This week, what you planned and your budget count only the days so far, so a half-finished week compares fairly.
With nothing to show, it says so and waits. Finishing a task or running a session fills it in.
The top line
The large figure is your time in the window, against your focus budget. The budget is the Focus cap in Settings multiplied by the days so far. It counts every day, weekends included.
Beside it, or under it on the iPhone:
- Planned adds up the estimates of tasks scheduled in those days, finished or not, and the timed events from calendars set to Treat as tasks. All-day events and other calendars don't count.
- Delivered is your time as a share of what you planned. If nothing was planned, it says nothing scheduled on the days so far.
The bar fills towards the budget. A line below it picks out the one thing most worth saying, in this order: the tag furthest from its plan, a day broken up by four or more switches, your longest block. If none of those applies, it says On plan so far.
Tracked time and time from estimates
Most of the review is time on the clock from your sessions. A running session counts up to now.
A finished task nobody timed still counts. If it had no session, or under a minute on the clock in total, the review counts its estimate instead, and treats that time as ending when you completed the task. A task with no estimate adds nothing.
Time from estimates is drawn hollow, in the same shade, so you can tell it apart. When there is any, a line says how the total splits, such as 6h 59m tracked · 25m from estimates.
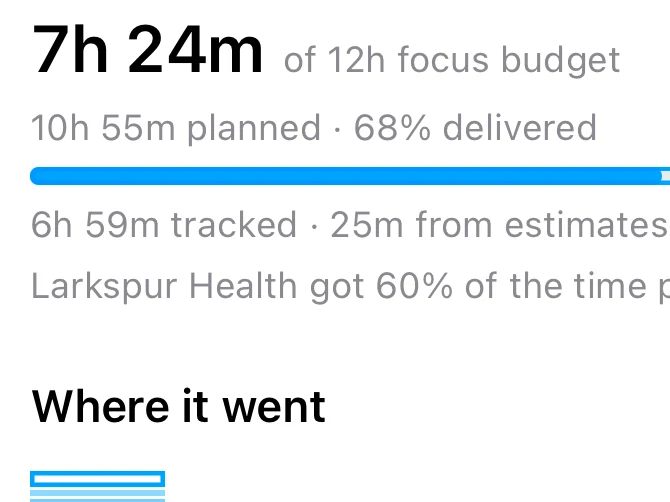
Estimates count towards your time, your tags and the time of day. They don't count towards switches or your longest block, which are about the clock. They also don't teach Matter anything about how long tasks take.
If you complete an event without timing it, it counts its scheduled time as tracked time, and is drawn solid.
Where it went
Each day is a column, stacked by tag in shades of blue, with the tag that has the most time in the window darkest. Under the columns, one bar splits the whole window by tag. The bar is left out when nothing in the window has a tag.
There is no legend, because each part tells you what it is:
- On the Mac, rest the pointer on a part. A segment of a column gives its day, tag and time, and the empty part of a column gives the whole day, with what was planned and any switches. A segment of the bar gives the tag's time, its plan and its share.
- On the iPhone, tap a column for its day, or the bar for a tag. The line takes the place of the sentences below, and tapping again brings them back.
A task with several tags has its time split evenly between them. A session that runs past midnight counts on each day in its own part.
Under the chart are two sentences:
- How time compared with the plan. It names the tag furthest from its plan if that tag ran 15% or more over or under, as in Larkspur Health got 60% of the time planned for it. Otherwise it says Time landed close to plan, or that nothing was scheduled to compare against.
- How broken up it was. The day with the most switches, and your longest unbroken block.
A switch is moving from one task or event to a different one with 30 minutes or less between them. A longer gap is a break. Sessions under five minutes don't count on either side. Within a tag means both had the same tags. In the longest block, pauses of up to five minutes on the same work are joined up.
When you work
The grid shows the day in three-hour blocks, from midnight on the left, with a row for each day. The more of a block you worked, the darker it is, and an empty block is grey. Rest the pointer on a block on the Mac, or tap it on the iPhone, to read it.
In Last 30 days the rows are weekdays, with all the Mondays added together and so on.
The sentence under it says where most of your work lands, such as Most work lands 9:00–18:00, and when it stops.
Pushed
This is how many times your open tasks have been pushed, on average, such as 0.1× per open task, with the count under it.
It reads your board as it stands today, across all of each task's pushes, so it is the same in every window.
When it updates
The iPhone keeps up as your data changes. The Mac reads once when the panel opens and when you change window, so close it and open it again to see newer numbers.
Both apps read the same synced data, so once iCloud has caught up they show the same figures and the same sentences.
Matter
To-do list that fits life
For the Mac and iPhone. It works offline, with no account.
Download for MacDownload for iPhone